
The Actual News:
I think Pokémon GO skews numbers slightly (albeit for the better).
OK so just as a quick reminder, each Pokémon in Pokémon GO has three stats—Attack, Defense and HP—and those stats are given some degree of variability through the use of IVs, which are numbered between 0 and 15, and therefore will total some value between 0 and 45. (To learn more about this system, consult the Pokémon GO page about it.)
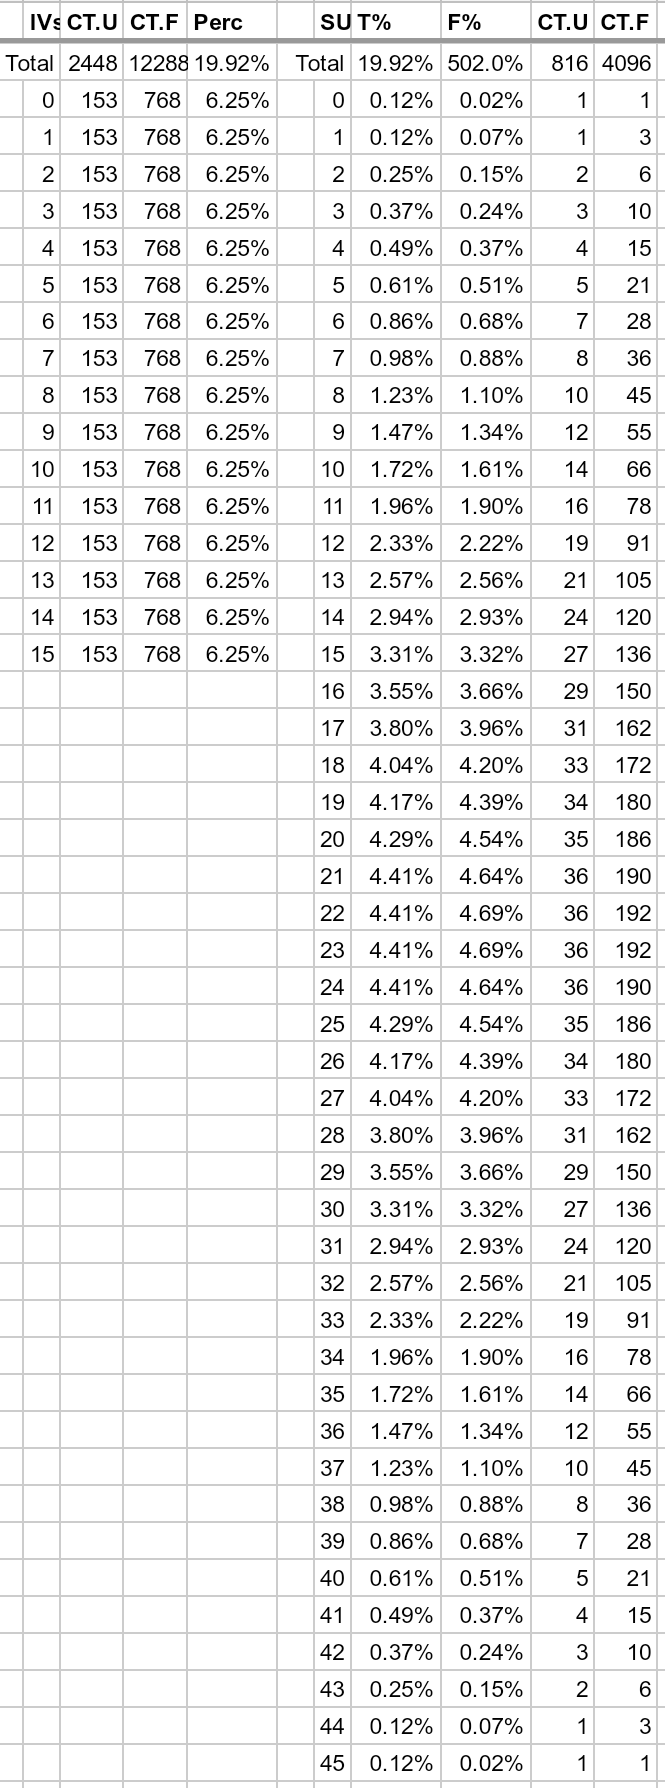
Anyways, if these IV values are evenly distributed, that means the chances you’ll get a Pokémon with any IV for any stat would be just as likely as any other, and the chances you’ll get a Pokémon with a total IV value of some number between 0 and 45 will be somewhere along this chart:
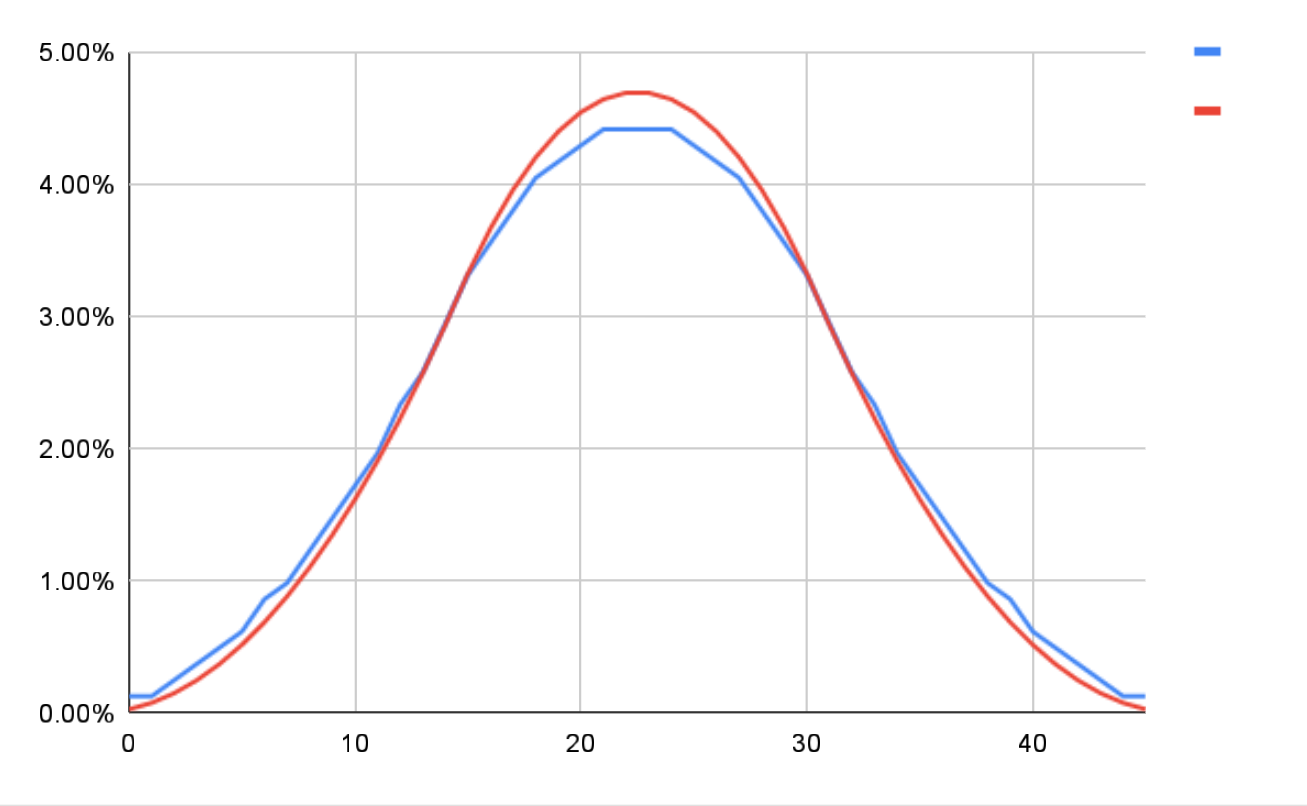
So for example, the chances that your Pokémon’s IVs will total 30 points (like maybe its Attack IV is 8, its Defense IV is 12, and its HP is 10) will be about 3.3%.
- (Side note, the two color bars represent two different values; the red bar represents all possible combinations of IVs, while the blue bar represents IVs where duplicates are removed. So for example, the IV total of 30 counts every unique combination of “8”, “12” and “10”, whether it’s A(ttack)8/D(efense)12/H(P)10, A8/D10/H12, A10/D8/H12, A10/D12/H8, A12/D8/H10, or A12/D10/H8. Meanwhile, for the blue bar, the IV total of 30 only counts the use of “8”, “12” and “10” only once, and thus doesn’t count those 5 other duplicates. Yeah yeah this is a lot of complex mathy stuff, but trust me that that’s the case.)
Furthermore, this data falls nicely along a normal distribution graph (aka “Bell curve.”) Basically all this means that you’ll have the highest chance of getting a perfectly average Pokémon, with the chances of getting a Pokémon with really really good or a really really bad stats decreases significantly.
Follow so far? Good.
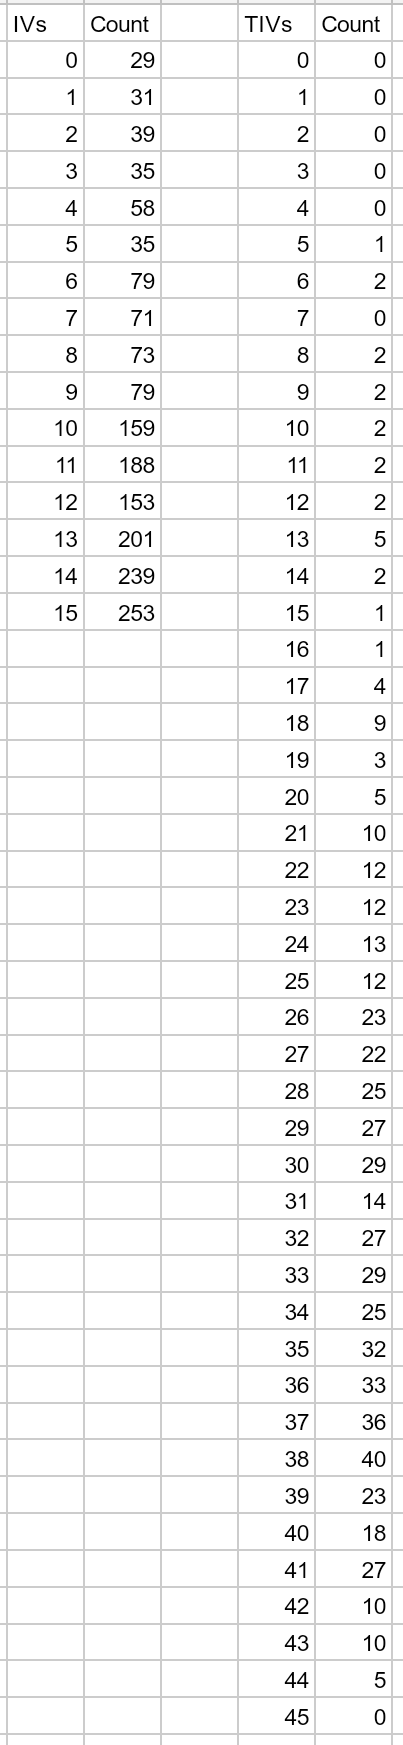
But here’s the rub: based on data of nearly 1000 caught Pokémon, the numbers I got are skewed slightly. Take a look:

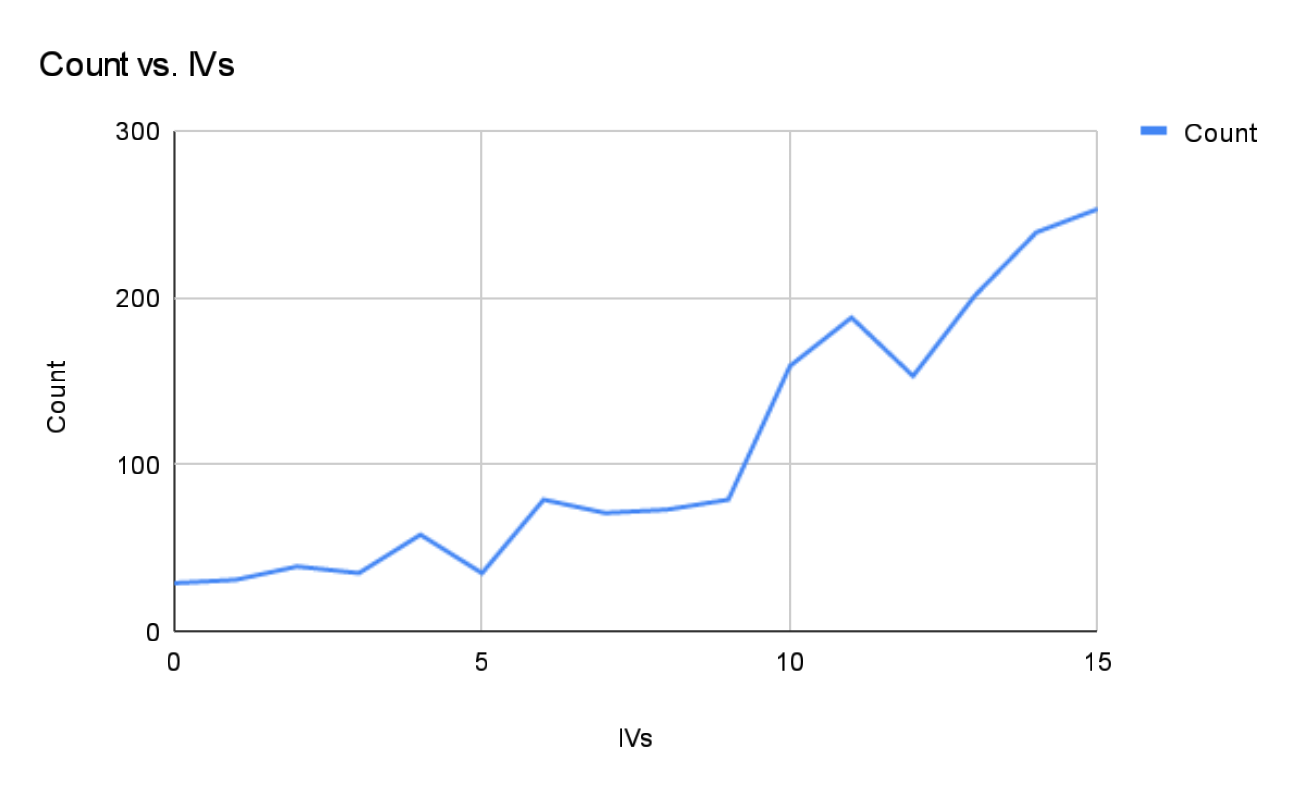
OK, the chart looks a bit jaggy, but hopefully you can see that this chart also has a “bell curve”… but the center of the bell is actually moved over to the right towards better stats. Another way this skew can be seen is in the below chart, which shows the number of times a particular IV value appears. It’s supposed to be a straight line across, as the chances of getting any particular IV value is supposed to be equal… but here you can see that my values are shifted towards higher values.
Now this can mean one of two things:
- Niantic ISN’T using an evenly randomized distribution of IVs, and have actually skewed the IV randomizer towards better stats.
- There may be an error in data recording on my part, as I do have a habit of getting rid of Pokémon with crappy stats WITHOUT recording their data.
I’ll easily admit the latter, although I did initially believe I was recording their data without prejudice. That is to say, a lot of this data came from me trying to work out which Pokémon to get rid of, and therefore it recorded ALL Pokémon, regardless of good or bad stats. This is also considering that I would’ve dumped ALL “bad” Pokémon, and yet there is still a slope in the data for the IV values below halfway, even though it should really be level.
Another thing I just caught was the idea that special Pokémon earned in raids and completing tasks for the Professor are intentionally given better stats, and I didn’t remove those Pokémon from the data.
So with all this in mind, I will give this study another try, but this time making sure I record ALL data for EVERY Pokémon I catch as well as NOT including the special Pokémon (or at least noting them). This may end up revealing that Pokémon IVs actually ARE evenly distributed, or maybe it’ll confirm this data afterall. I can’t wait to see!
…
In the mean time, here is the raw data. Enjoy!
Stay tuned!