The Actual News:
Power creep, for those who aren’t aware, is the tendency for a trading card game (like Magic the Gathering at the Pokémon TCG) to slowly produce stronger and more powerful cards. As in, this added power slowly creeps it’s way into the game.
Now I’ve always wondered about whether or not power creep exists in the Pokémon TCG… so I’d thought I’d look into this. However, the game is over 20 years old now, so going through every single card and each of its attacks is a lesson in tedium. But alas, sometimes hard question require some hard work to answer.
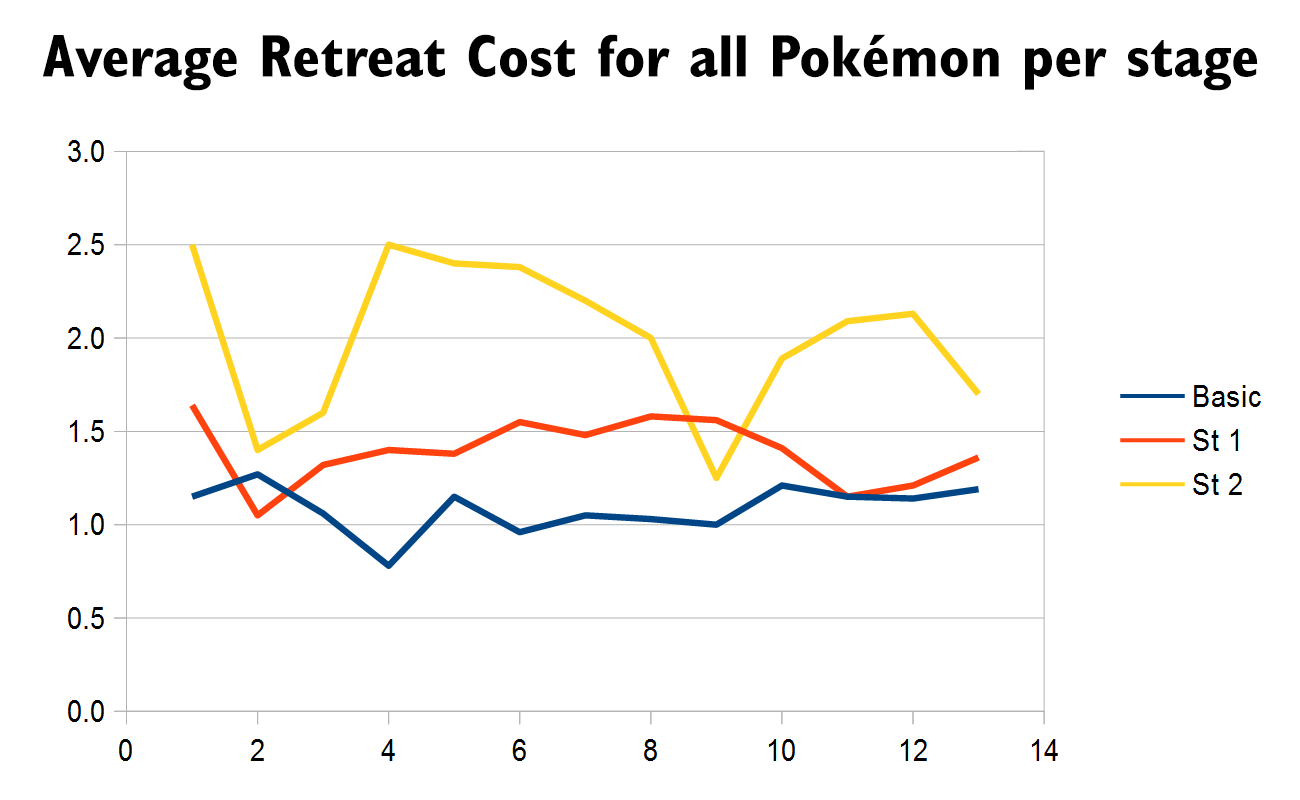
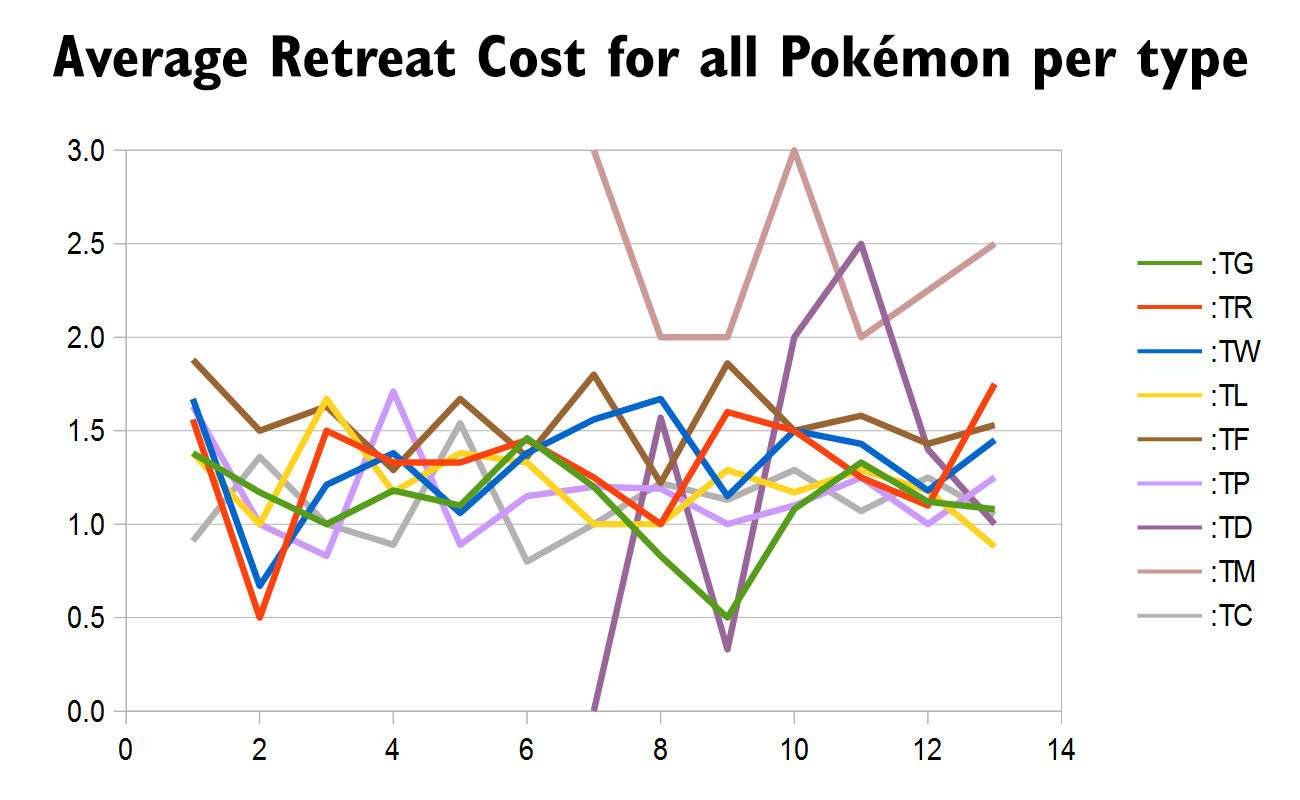
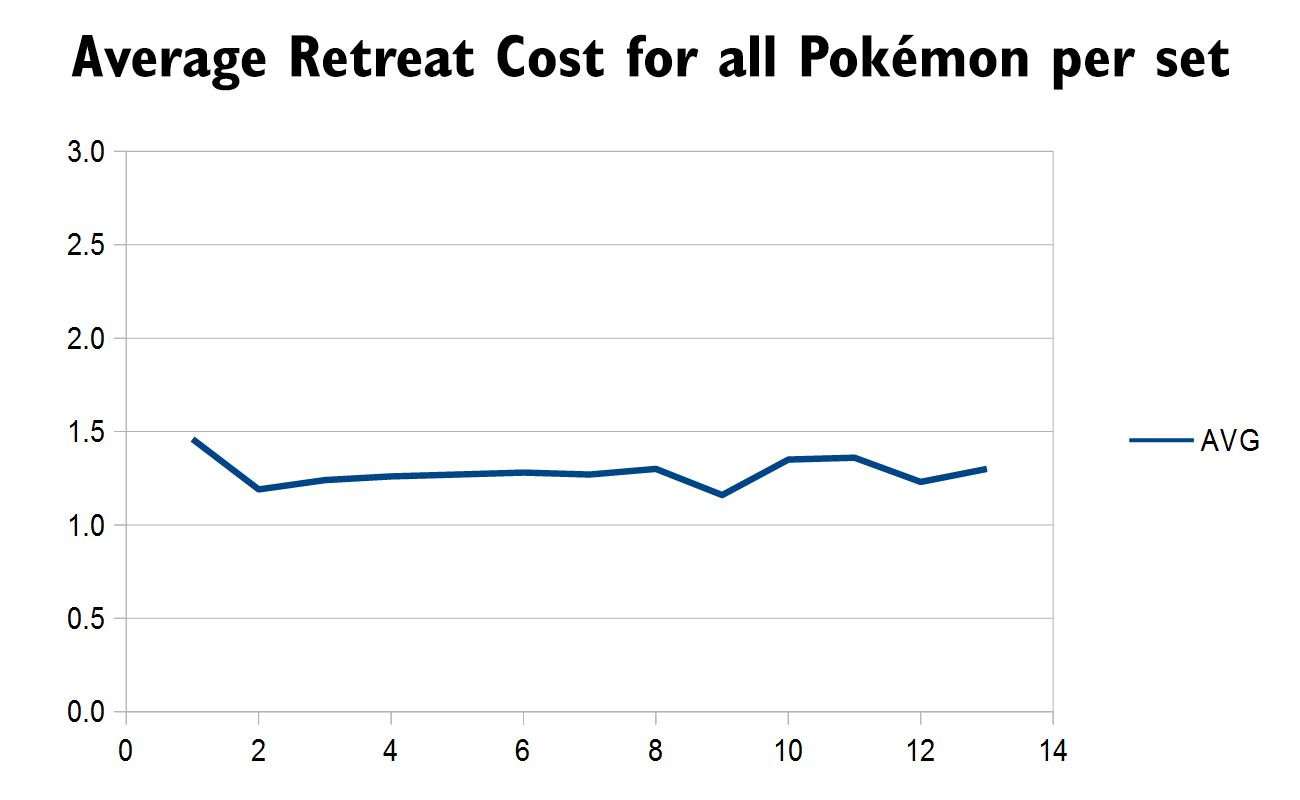
Seriously though, I did try to figure out an effective and efficient way to detect power creep in the game, and right now I think gathering data on the average HP for each Pokémon card across each set, type, and stage. While I was at, I figured I’d also get data on their retreat costs too, to see if maybe that was another metric which could detect any other shifts in card design.
And so, the first fruits of my efforts can be seen below. I ultimately covered the first 13 sets, covering essentially all of the (non-reprint) sets released by Wizards of the Coast: Base Set to Skyridge.
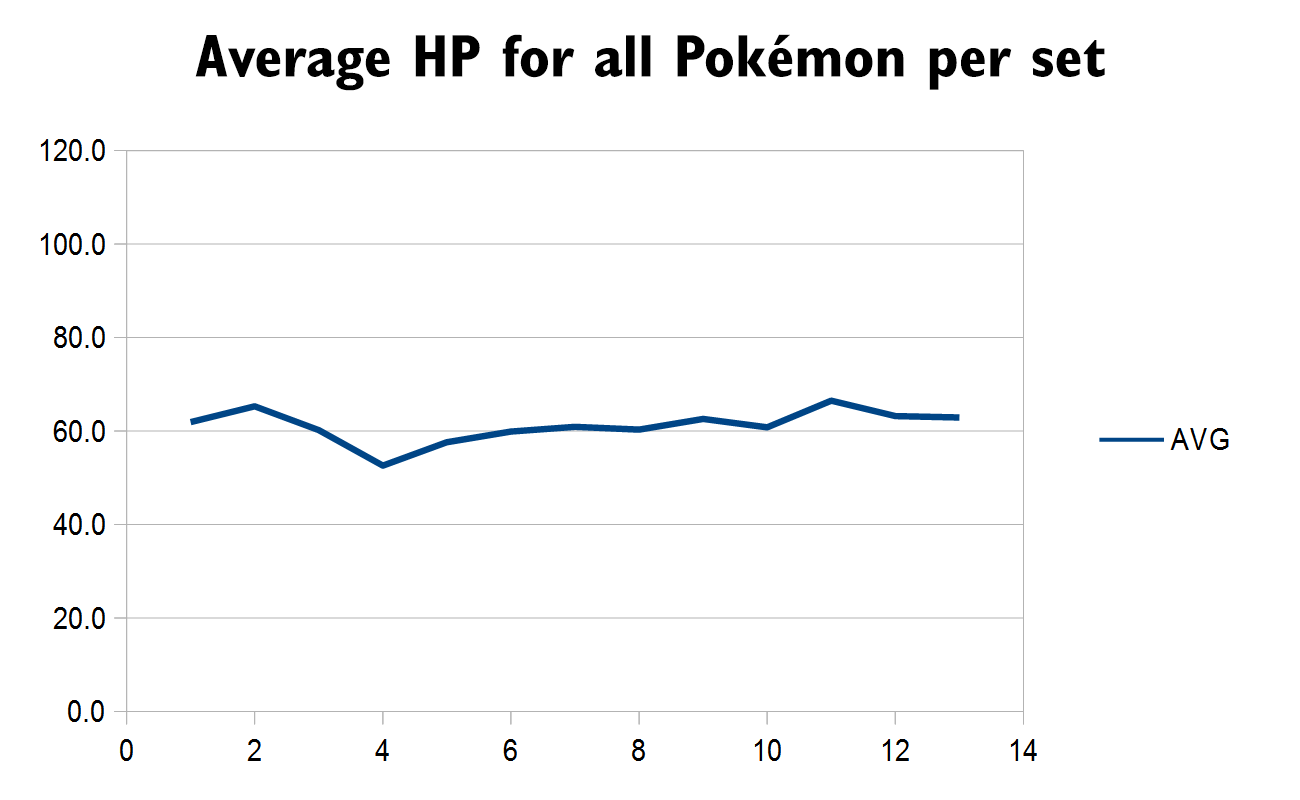
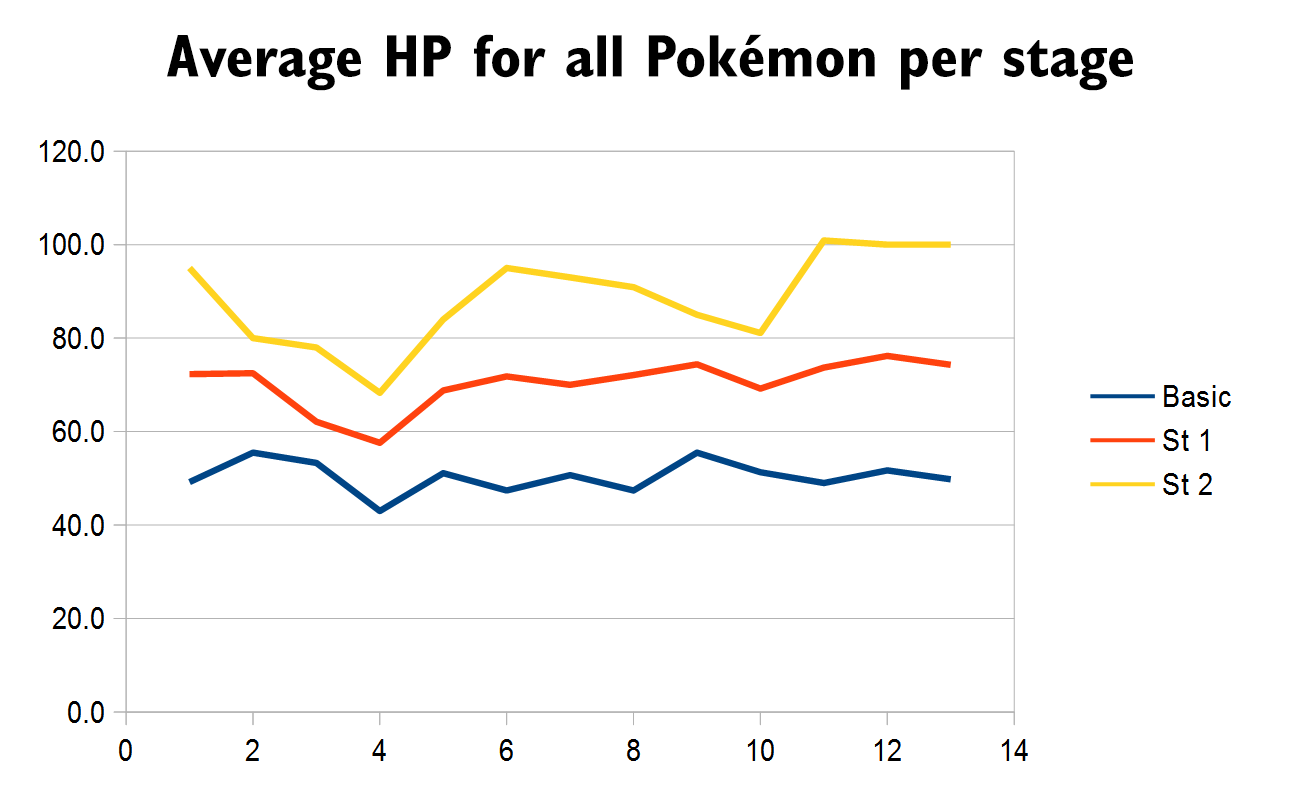
Hmmmm… not much to see here, huh? You can at least see some interesting shifts in the HP for Pokémon per set… for example, the Team Rocket set deliberately gave “Dark” Pokémon lower HP, which is clearly reflected in the HP graph (located at Set #4). And then from that point onward, you can see average HPs growing ever so slowly higher until the last set… incidentally peaking at Set #11, which is Expedition (the first Card-e set and, IIRC, the first set with the new backs in Japan).
Now does this reflect a power creep? I can’t say quite yet. After all, I’ve only covered the first four years of the game. But I do believe that ever-so-slightly increase in average HP from Team Rocket as a sign of the start of a power creep. However the REAL test will be the start of the Nintendo-era, beginning with ADV/EX Ruby & Sapphire and the introduction of ex-type Pokémon. Now I do plan on keeping ex-data separate, as well as all subsequent “special” types of Pokémon cards, just to make sure it doesn’t skew data. And then once I get the HP data worked out, I’m gonna think about how to get attack data properly analyzed… like maybe just focusing on vanilla attacks, or actually separating each type of attack and track that data over each set as well? Lemme get back to you about this.
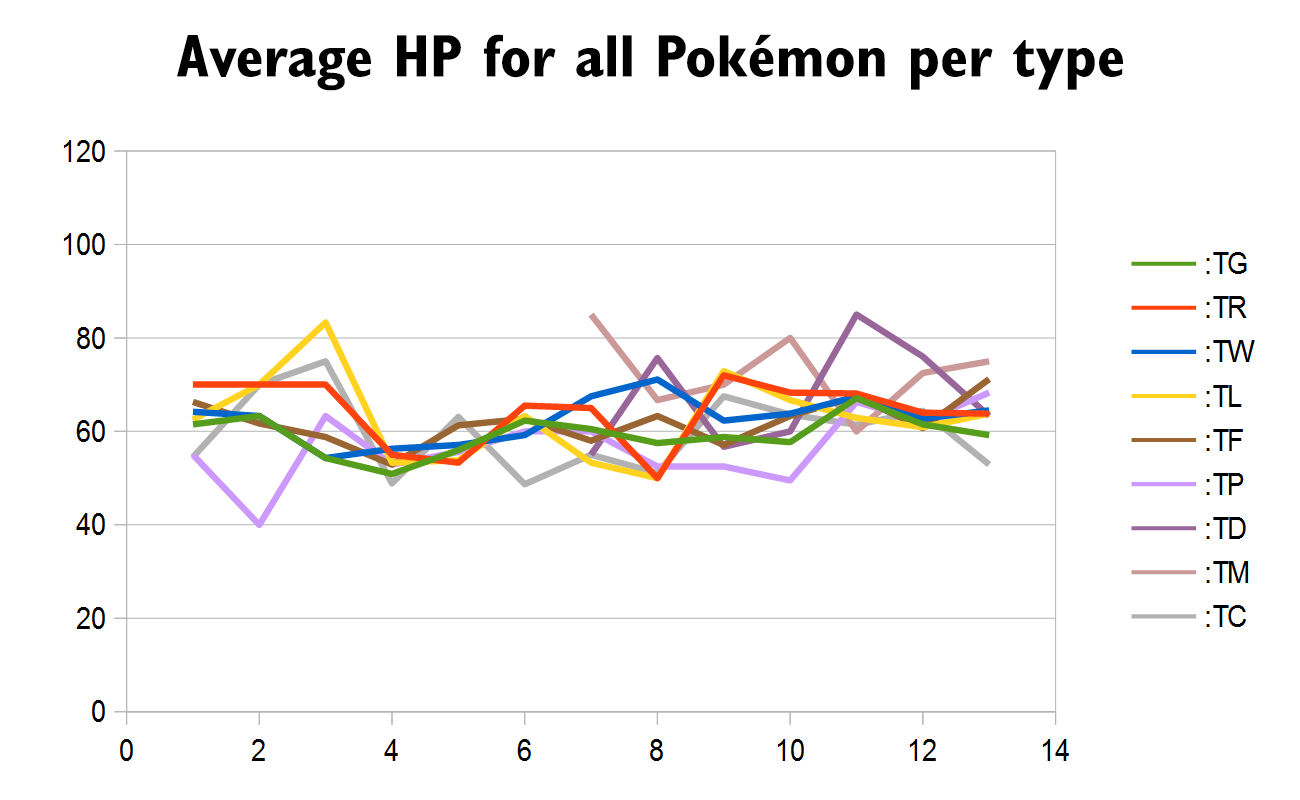
Anyways, that’s bascially all I have to analyze right now. Below is my ACTUAL data that I’ve actually generated along with four other graphs where I break down both HP and RC according to Stage (Basic, Stage 1 and Stage 2) and Type (obviously not counting Dragon and Fairy types). Maybe you’ll pull some additional meaning from it?
| HP Averages | AVG |  |
 |
 |
 |
 |
 |
 |
 |
 |
Baby | Basic | St 1 | St 2 |
| 01 – Base | 61.9 | 61.5 | 70.0 | 64.2 | 62.5 | 66.3 | 55.0 | 54.5 | 49.2 | 72.3 | 95.0 | |||
| 02 – Jungle | 65.3 | 63.3 | 70.0 | 63.3 | 70.0 | 61.7 | 40.0 | 70.0 | 55.5 | 72.5 | 80.0 | |||
| 03 – Fossil | 60.2 | 54.3 | 70.0 | 54.3 | 83.3 | 58.8 | 63.3 | 75.0 | 53.3 | 62.1 | 78.0 | |||
| 04 – Team Rocket | 52.6 | 50.9 | 55.0 | 56.3 | 53.3 | 52.9 | 52.9 | 48.9 | 43.0 | 57.6 | 68.3 | |||
| 05 – Gym Heroes | 57.6 | 56.0 | 53.3 | 57.1 | 53.8 | 61.3 | 55.6 | 63.1 | 51.1 | 68.8 | 84.0 | |||
| 06 – Gym Challenge | 59.9 | 62.3 | 65.5 | 59.2 | 63.3 | 62.7 | 60.0 | 48.7 | 47.4 | 71.8 | 95.0 | |||
| 07 – Neo Genesis | 60.9 | 60.5 | 65.0 | 67.5 | 53.3 | 58.0 | 60.0 | 55.0 | 85.0 | 55.0 | 30.0 | 50.7 | 70.0 | 93.0 |
| 08 – Neo Discovery | 60.3 | 57.5 | 50.0 | 71.1 | 50.0 | 63.3 | 52.5 | 75.7 | 66.7 | 51.1 | 30.0 | 47.4 | 72.1 | 90.9 |
| 09 – Neo Revelations | 62.6 | 58.8 | 72.0 | 62.3 | 72.9 | 57.1 | 52.5 | 56.7 | 70.0 | 67.5 | 30.0 | 55.5 | 74.4 | 85.0 |
| 10 – Neo Destiny | 60.8 | 57.7 | 68.3 | 63.8 | 66.7 | 63.3 | 49.5 | 60.0 | 80.0 | 63.6 | 51.3 | 69.2 | 81.1 | |
| 11 – Expedition | 66.5 | 67.1 | 68.1 | 67.4 | 62.9 | 67.5 | 66.3 | 85.0 | 60.0 | 61.4 | 30.0 | 49.0 | 73.7 | 100.9 |
| 12 – Aquapolis | 63.2 | 61.5 | 64.0 | 62.7 | 60.9 | 60.7 | 62.2 | 76.0 | 72.5 | 64.4 | 30.0 | 51.7 | 76.2 | 100.0 |
| 13 – Skyridge | 62.9 | 59.2 | 63.8 | 64.5 | 63.8 | 71.2 | 68.3 | 63.3 | 75.0 | 52.9 | 30.0 | 49.8 | 74.3 | 100.0 |
| –– Average | 61.4 | 60.1 | 64.8 | 62.8 | 62.0 | 62.9 | 57.1 | 69.6 | 72.4 | 58.6 | 30.0 | 50.3 | 70.9 | 91.6 |
| Retreat Costs | AVG | |
|
|
|
|
|
|
|
|
Baby | Basic | St 1 | St 2 |
| 01 – Base | 1.46 | 1.38 | 1.56 | 1.67 | 1.38 | 1.88 | 1.63 | 0.91 | 1.15 | 1.64 | 2.50 | |||
| 02 – Jungle | 1.19 | 1.17 | 0.50 | 0.67 | 1.00 | 1.50 | 1.00 | 1.36 | 1.27 | 1.05 | 1.40 | |||
| 03 – Fossil | 1.24 | 1.00 | 1.50 | 1.21 | 1.67 | 1.63 | 0.83 | 1.00 | 1.06 | 1.32 | 1.60 | |||
| 04 – Team Rocket | 1.26 | 1.18 | 1.33 | 1.38 | 1.17 | 1.29 | 1.71 | 0.89 | 0.78 | 1.40 | 2.50 | |||
| 05 – Gym Heroes | 1.27 | 1.10 | 1.33 | 1.06 | 1.38 | 1.67 | 0.89 | 1.54 | 1.15 | 1.38 | 2.40 | |||
| 06 – Gym Challenge | 1.28 | 1.46 | 1.45 | 1.38 | 1.33 | 1.36 | 1.15 | 0.80 | 0.96 | 1.55 | 2.38 | |||
| 07 – Neo Genesis | 1.27 | 1.20 | 1.25 | 1.56 | 1.00 | 1.80 | 1.20 | 0.00 | 3.00 | 1.00 | 0.00 | 1.05 | 1.48 | 2.20 |
| 08 – Neo Discovery | 1.30 | 0.83 | 1.00 | 1.67 | 1.00 | 1.22 | 1.19 | 1.57 | 2.00 | 1.22 | 0.00 | 1.03 | 1.58 | 2.00 |
| 09 – Neo Revelations | 1.16 | 0.50 | 1.60 | 1.15 | 1.29 | 1.86 | 1.00 | 0.33 | 2.00 | 1.13 | 0.00 | 1.00 | 1.56 | 1.25 |
| 10 – Neo Destiny | 1.35 | 1.08 | 1.50 | 1.50 | 1.17 | 1.50 | 1.10 | 2.00 | 3.00 | 1.29 | 1.21 | 1.41 | 1.89 | |
| 11 – Expedition | 1.36 | 1.33 | 1.25 | 1.43 | 1.29 | 1.58 | 1.25 | 2.50 | 2.00 | 1.07 | 1.00 | 1.15 | 1.15 | 2.09 |
| 12 – Aquapolis | 1.23 | 1.12 | 1.10 | 1.18 | 1.18 | 1.43 | 1.00 | 1.40 | 2.25 | 1.25 | 1.00 | 1.14 | 1.21 | 2.13 |
| 13 – Skyridge | 1.30 | 1.08 | 1.75 | 1.45 | 0.88 | 1.53 | 1.25 | 1.00 | 2.50 | 1.05 | 1.00 | 1.19 | 1.36 | 1.70 |
| –– Average | 1.29 | 1.16 | 1.37 | 1.36 | 1.20 | 1.54 | 1.17 | 1.29 | 2.33 | 1.13 | 0.50 | 1.10 | 1.38 | 2.04 |

ff