
First off: Happy Birthday to my best friend, Jimmy C. (aka Teslalyte)! Today he celebrates being alive for thirty-ssfrthgbb…. consecutive years! That’s a pretty awesome feat! Keep on keepin’ on, Jim! :D
Secondly: apparently there’s some real shit going down with Pokémon Unite… turns out that it’s actually quite unpopular with other Pokémon fans. But why? Let’s look into it next time…
The Actual News:
Ok so in the background I’ve been working on all kinds of projects, ad I’ve always done… one if which being looking a bit deeper into the Pokémon GO Stats randomization system. If you need a refresher on how Pokémon GO’s ststs work, check out the GO page… but basically the idea here is that, if Pokémon GO’s stats were randomly generated, then…
- The graph of the total number of each IVs generated (whether Attack, Defense or HP; left) should be a flat, horizontal line, meaning that every IV was generated equally
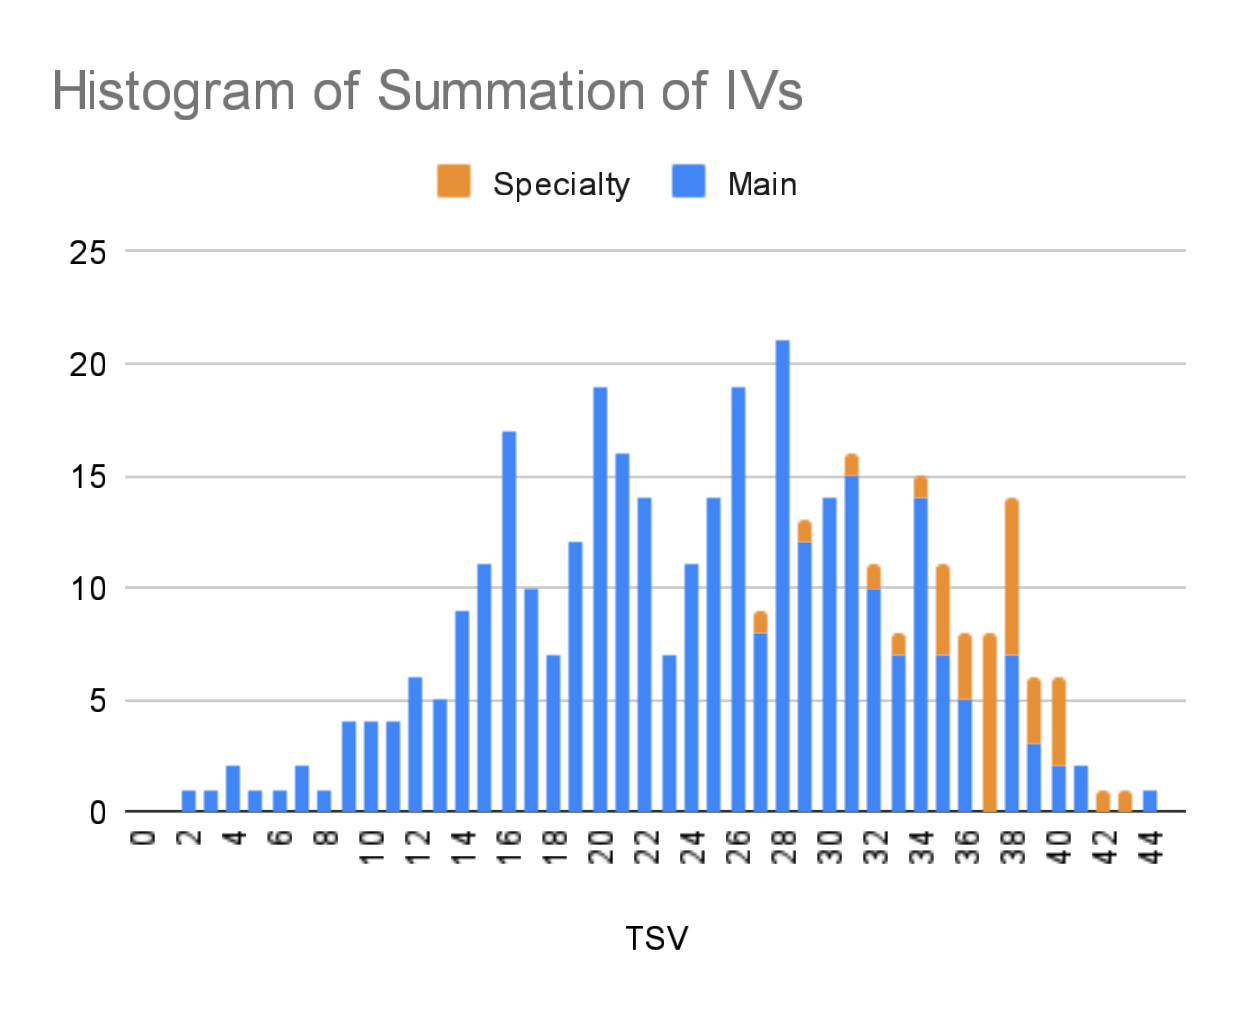
- The graph of the total number of summed IVs (as in Attack + Defense + HP; right) is a bell curve centered between 22 and 23).
However, when I actually chart the raw data straight from the game, I get graphs which are skewed towards higher IVs. I mean, that part isn’t an issue per se, it’s just that this means the IV generation isn’t truly randomized.
Since my last post, I managed to record data on over 300 Pokémon (technically 326), and I managed to stumble upon an interesting observation. First off, take a look at the data graphs:
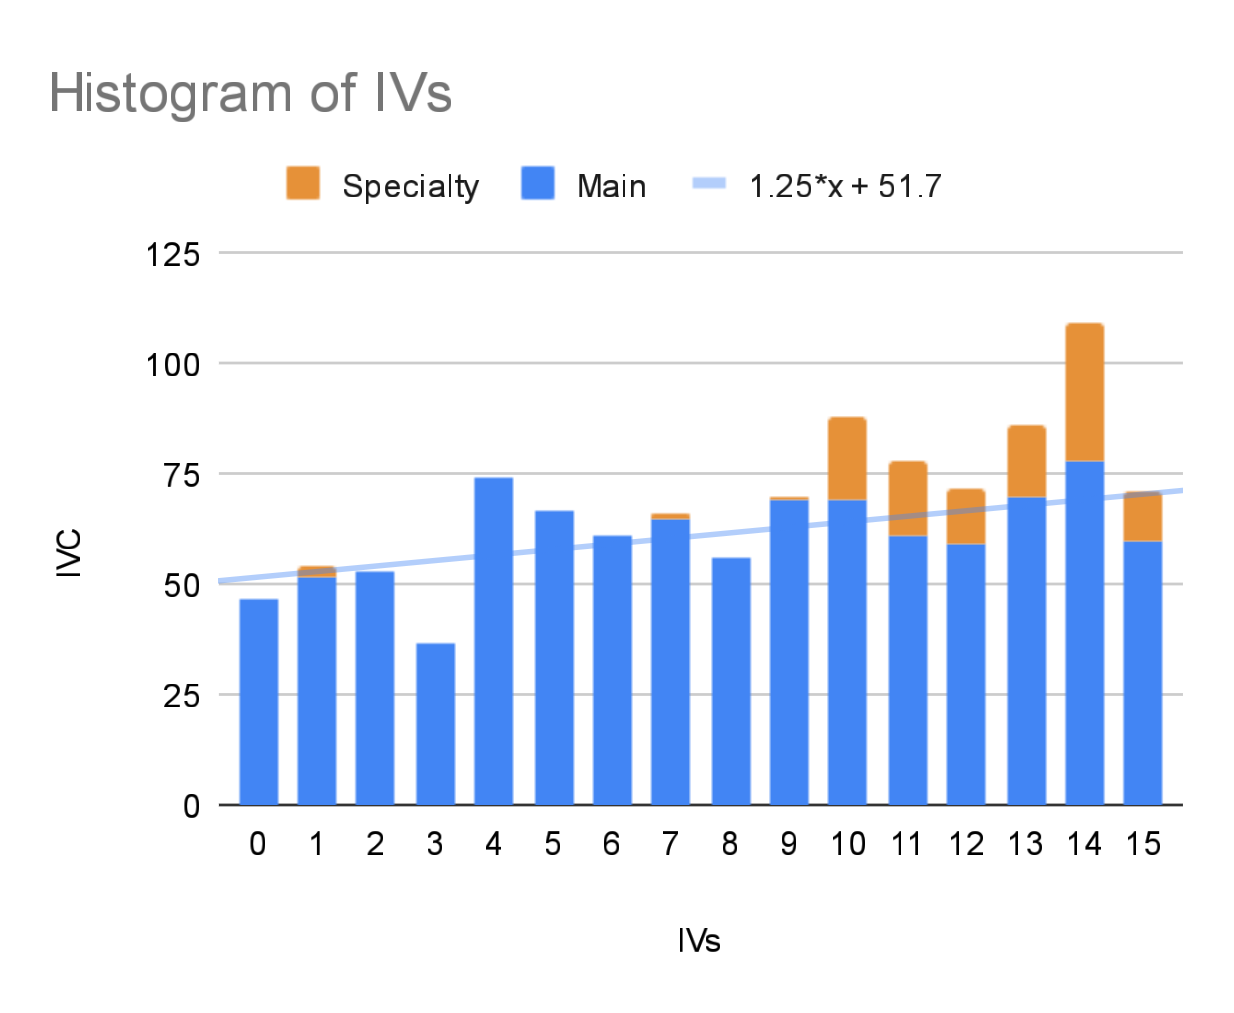
As a reminder, the line on the left graph is the trend line, which reflects the general growth trend of the data with each step. You can also see the trend equation in the legend; a value of “0*x” means a horizontal line, while an increasing value means an increasingly steeper snd steeper slope, with positive and negative values representing “uphill” and “downhill” slopes, respectively.
Also of note is that the main data is colored blue. The orange data, on the other hand, are Pokémon which I’ve termed as “special”… namely Pokémon generated from eggs, or fulfilling tasks from Professor Willow, etc, but NOT Shadow Pokémon captured from Team GO Rocket. THOSE actually have significantly WORSE data, but I’ve yet to include those Pokémon into my data. Maybe next time…
Anyways… as you can see, even after over 300 Pokémon, there is still a slope showing a bias towards higher IVs. And this bias hasn’t exactly gone away with all of the data I keep adding, as more data tends to mean leas errors.
Buuuuuutttt actually…. this “more data = less errors” thing has actually revealed something I didn’t see before. Specifically, when I removed the entries covering IVs 0 to 3, and just focus on the data for IVs 4 to 15, I got the following graph.
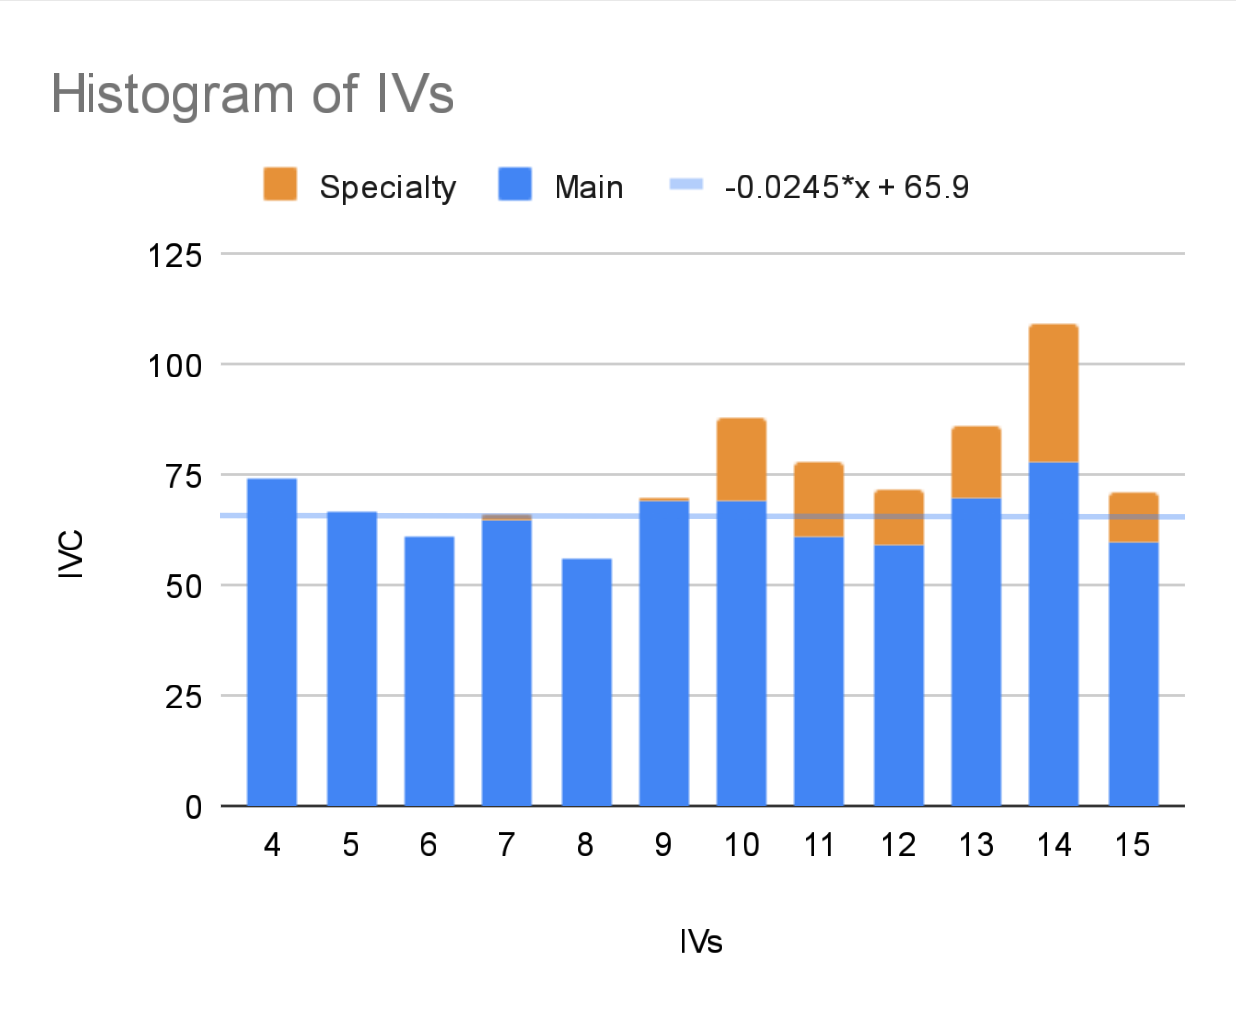
Whawhawhawhaaaat?? Does this show a fairly even distribution? I mean, look at that trend line: it’s about as horizontal as it’s ever been! It’s even reflected in the trend line equation: -0.0245*x +65.9… its actually a NEGATIVE, meaning a bias against the higher values (however small it actually is).

More like advanced shit data.gif. … no wait
So what does this mean? Well as always I still need more data, but it may mean that I was slightly wrong with initial hypothesis that the IV randomizer is skewed towards generating higher IV values. Rather, it may be that the IV randomizer is programmed to generate less IVs between 0 and 3 relative to the other IVs from 4 to 15. By how much, I can’t quite yet… so far it seems like maybe around 33% fewer, but lemme get back to you on that.
Anyways, that’s just about everything I have to share with you today. I guess maybe it was only one major reveal, but it actually lead to two new ideas: that maybe it isn’t generating more of the higher IVs, but it’s instead generating fewer of the lower IVs. That may just be a technicality but I think it actually is more than that. But we’ll see with more data.
Huzzah! Good times.
1 Comment
Hard drive travels